The USDA's latest World Agricultural Supply and Demand Estimates ((WASDE)) report surprised the corn / grains markets to the upside, as estimates of yield per acre were revised downwards and estimated carried inventories were reduced. The 2010-11 average farm price projection is raised 10 cents on both ends of the trading range to $4.90-5.70/bushel, as cash and futures prices are expected to strengthen. These reductions in the estimates of yield are in line with expected corn price drivers movements mentioned in my article here.
[Click all to enlarge]
It is expected that in most of the major grain producers like the U.S., Brazil, Argentina, Australia and Russia, corn yields will further deteriorate and face downgrades because of floods in Australia, Brazil, and South Asia; droughts in Argentina and Russia; and generally unexpected weather driven by the La Nina effect.
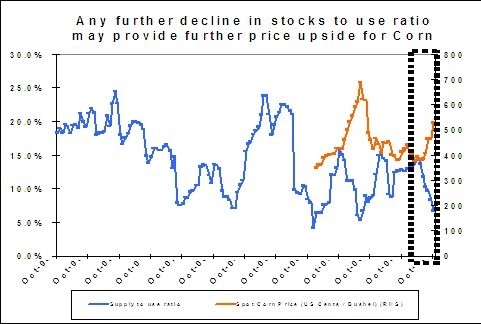
It is estimated that China corn and wheat imports in 2010-11 will be revised upwards. The world is likely to face export deficits. The larger picture suggests continuous high corn prices, as corn inventories are at extremely tight levels due to strong demand. Corn prices may challenge $10 / bushel and soybean prices may challenge $13 / bushel as well, if price sensitivity to year end stocks is in line with our estimates, during the first half of 2011.
Near-term corn and soybean prices will depend on expectations for the March and April 2010 USDA production and consumption forecasts. A drop in South American exports will further decrease the corn trade, which will be positive for corn / grain prices. The combination of an increase in demand with a decline in supply will tighten the corn market beyond the market's expectations.

Following is a summary of salient observations from USDA January 12, 2010 report:
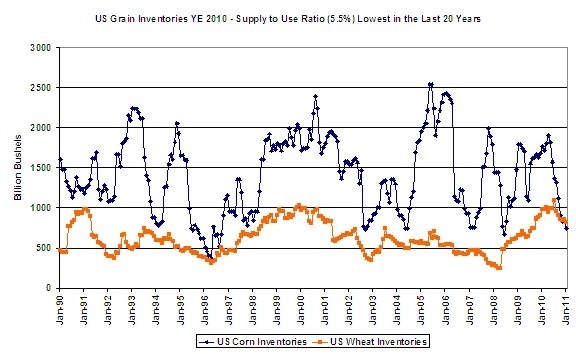
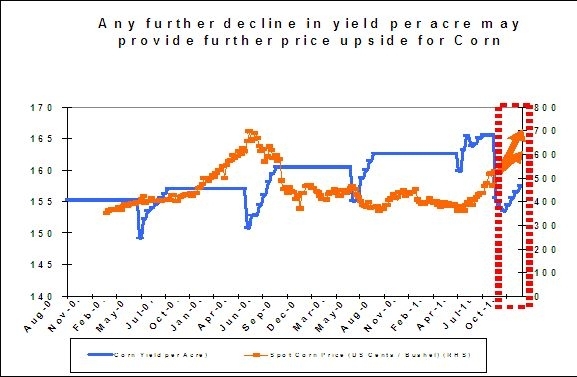
- Corn: As per the January 2011 report, the USDA projected a 1.5 bu./acre yield decrease, outweighing a 2010 acreage increase of 183,000 acres. Corn carryover dropped to 745 million bushels, which is 87 million bushels lower than the December 2010 report. Corn for grain production is estimated at 12.4 billion bushels, down 1% from the Nov. 1 forecast and 5% below the record-high production of 13.1 billion bushels, set in 2009. This implies a stock-to-use ratio of 5.5%, the lowest since 1995-96.
- Wheat: U.S. wheat ending stocks for 2010-11 have been projected to be 40 million bushels lower in January 2011 as a reduction in expected feed and residual use is more than offset by higher projected exports. Estimates of global 2010-11 wheat supplies have been raised slightly this month, as increased beginning stocks are mostly offset by lower foreign production. World wheat imports and exports for 2010-11 are both raised slightly. Global 2010-11 wheat consumption is projected to be 1.2 million tons lower, mostly reflecting reduced wheat feeding in the EU-27, the United States, and Kazakhstan.
- Oilseeds: Oilseed production is down 1.2% at 100.5 million tons. Soybean production is estimated at 3.329 billion bushels, down 46 million bushels. Lower yield and reduced harvested acreage are to blame.
Drivers to Watch:
- Grain Stocks: Total corn stored at the start of December totaled 10.0 billion bushels, down 8% yoy. Its indicated disappearance is 4.11 billion bushels, compared with 3.86 billion bushels during the same period last year. U.S. grain supplies for 2010-11 have been estimated down, reflecting lower corn production. U.S. corn production is estimated at 93 million bushels lower, as a 1.5-bu./acre reduction in the U.S. average yield outweighs an 183,000-acre increase in harvested area.
- Global Corn Production: Global corn production is lowered 4.7 million tons with the U.S. reduction and a 1.5-million-ton decrease for Argentina as untimely, persistent dryness during late December and early January reduces yield prospects in key central growing areas. Smaller reductions in corn output are also projected for Indonesia and Turkey, each down 0.4 million tons.
- Yield per Acre: U.S. grain yield for 2010 is estimated at 152.8 bushels/acre. This is down 1.5 bushels from the November forecast and 11.9 bushels below the record-high yield of 164.7 bushels, set in 2009. Yield per acre figures in Brazil, Argentina and Australia are likely to be revised downwards in March and April, WASDE reports, which will be positive for corn prices.
- Acreage: The area harvested for grain is estimated at 81.4 million acres, up slightly from the November forecast and up 2% from 2009 -- but not enough to outweigh an estimated decline in yield. This estimate is unlikely to be raised upwards, and may not change the supply estimates substantially.
- Ethanol (E12) Use: Corn used for ethanol is raised 100 million bushels, offsetting the reduction in expected feed and residual use. Record December ethanol production, as indicated by weekly Energy Information Administration ((EIA)) data, boosts corn use to date. EIA weekly reports showed that the ethanol market is still relatively tight. Production is estimated to rise further (estimated at 875,000 barrels per day), per the EPA’s E15 decision.
Investment Implications:
- Increase in prices of nitrogen, potash and phosphate.
- increase in price of other grains and & agriculture commodities like cotton and sugar (price increase).
- Effect on corn feedstock industries (margin squeeze).
- Meat prices are already higher 15% year on year (highest level since the 1980s) and can go even higher (hog futures price increase).
- Price of farm machinery, fertilizers and seeds (prices increase).
Fertilizer Market:
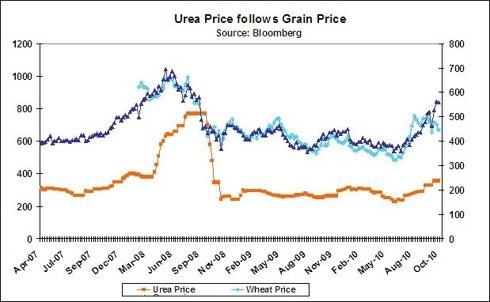
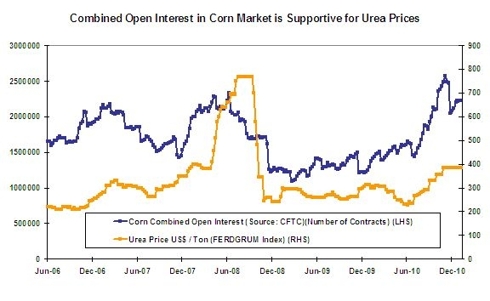
Fertilizer demand plays a key role in the market situation. According to industry experts who provided presentations at the 2010 Fertilizer Outlook and Technology Conference, demand for the three major nutrients is expected to increase for the 2010-11 crop year. Today’s fertilizer market follows the 2008-09 tumble in crop prices, which fueled a dramatic price-induced drop in domestic and international fertilizer use.
Between their peak in October/November 2008 and December 2009/January 2010, fertilizer prices paid by U.S. farmers dropped 52 percent. The industry is once again experiencing strong crop prices, rising fertilizer prices at the wholesale level, and very tight fertilizer inventories. According to the USDA, fertilizer prices paid by U.S. farmers are up 14 percent year-to-date (through November), but prices at the wholesale level have been rising more rapidly. Recent grain price increases have led to a spike in world fertilizer demand, as farms are requiring additional inputs and buyers are scrambling to acquire available supplies for farm use and inventory replenishment. Higher demand, coupled with lower available fertilizer supplies in the August to October time frame, led to sharp increases in fertilizer prices.


Investment Themes & Vehicles:
Many investment vehicles / themes are available to play La Nina and a spike in agricultural prices, which include direct futures investment, ETFS, equities, agricultural implement equities, fertilizer stocks and options on corn prices and agricultural / fertilizer equities and substitutes (MEG producers as a substitute for cotton).
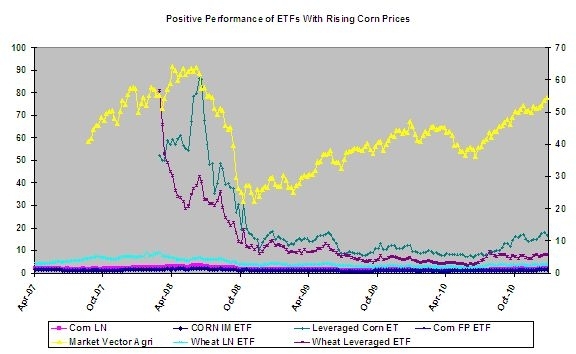
ETFS:
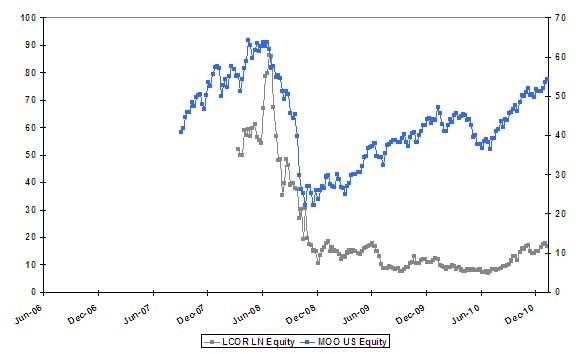
- Focused ETFs: ETFS Corn ETF (CORN), ETFS Leveraged Corn ETF (LCOR), ETFS Leveraged Soybean Oil ETF (LSYO), ETFS Leveraged Soybeans ETF (LSOB), ETFS Leveraged Wheat ETF (LWEA) , ETFS Soybean Oil ETF (SOYO), ETFS Soybeans ETF (SOYB), ETFS Wheat ETF (WEAT)
- Diversified Agriculture: Dow Jones-AIG Grains Total Return ETN (JJG) ETFS Grains ETF (AIGG), ETFS Grains Sterling ETF (AGGP), ETFS Leveraged Grains ETF (LGRA), iPath Down Jones – UBS Grains Subindex ETN (JJA): 38% soybeans, corn (37%) and wheat (25%) – MER 0.75%, The Powershares DB Agriculture ETF (DBA) 11 commodities (including livestock) (soybeans, corn and wheat -34%) – MER0.85%.
- Late Cycle: Market Vectors Agribusiness ETF (MOO) – 47 companies in agri business including Deere (DE) as its number one holding.
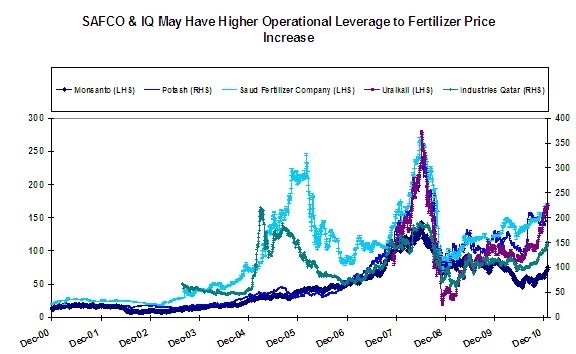
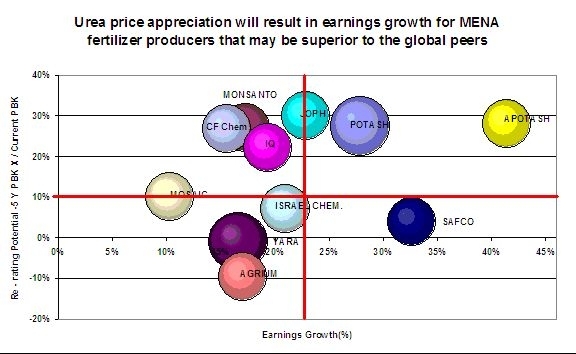
Equities: Global fertilizer stocks like Potash Corp. (POT) (8.99% YTD), CF Chemicals (CF) (4.9% YTD), Monsanto (MON), Uralkali (URALY.PK), Industries Qatar (10% YTD, PER 12.9X, Dividend Yield of 3.29%), Saudi Fertilizer Company (6.88% YTD, Dividend Yield 7%, PER of 13.9X), Maaden (9.44% YTD) and Yara (YARIY.PK) are the viable choices to play agricultural inflation.

Substitutes: It may be worthwhile to look at producers of some substitutes which have lagged the equities related to agri-inflation, directly or indirectly. One of the examples of such substitutes is MEG, which substitutes for cotton. Yanbu Petrochemicals Company is the world largest producer of MEG, and 2011 will be its first full year of commercial output.
Disclosure: I have no positions in any stocks mentioned, and no plans to initiate any positions within the next 72 hours.
Complete Story »
Samantha Mathis Samantha Morton Grace Park Jill Wagner Susie Castillo
No comments:
Post a Comment